SDG 11: affordable housing in numbers, and how to check that a rent is fair
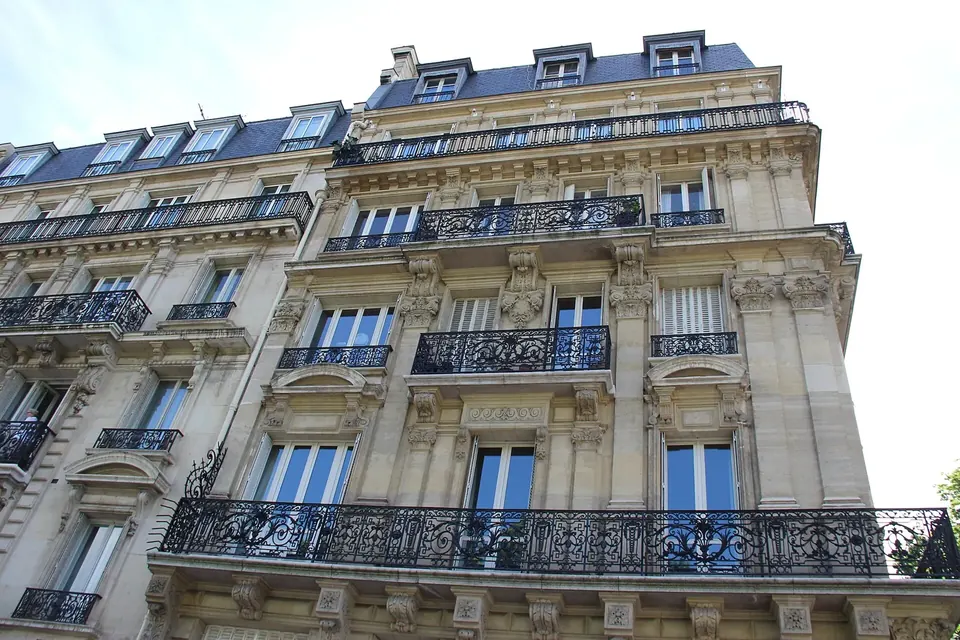
Target 11.1 of the Sustainable Development Goals reads: "By 2030, ensure access for all to adequate, safe and affordable housing and basic services and upgrade slums." Article 25 of the Universal Declaration of Human Rights already listed housing as part of an adequate standard of living; the 2030 Agenda adds a commitment to measure it. This explainer sets out the official figures, with their reference years, and then a practical question: how a tenant can tell whether a rent is fair.
What indicator 11.1.1 measures
The official indicator is 11.1.1, the proportion of urban population living in slums, informal settlements or inadequate housing. Its custodian is UN-Habitat. Under the UN metadata (last updated in December 2021), a slum household is one that lacks at least one of five things:
- access to an improved water source;
- access to improved sanitation;
- sufficient living area, which in practice means not more than three people sharing a habitable room;
- a durable dwelling, on a non-hazardous site;
- security of tenure.
The "inadequate housing" component is measured through affordability. The metadata treat a home as unaffordable when the household's net monthly spending on housing exceeds 30% of its total monthly income. A footnote adds a stricter benchmark sometimes used for renters: a rent-to-income ratio of 25% or less. The metadata note that the indicator does not capture homelessness.
The global picture
According to the UN's Sustainable Development Goals Report 2024, 24.8% of the world's urban population lived in slums or informal settlements in 2022, slightly lower than 25% in 2015 but higher than 24.2% in 2020. That was 1.12 billion people, 130 million more than in 2015, and it reversed a decline observed from 2000 to 2020. UN-Habitat considers the reversal likely to reflect the impact of COVID-19 on urban poverty.
| Region (2022) | People in slums | Share of urban population |
|---|---|---|
| Eastern and South-Eastern Asia | 362 million | 24.8% |
| Central and Southern Asia | 334 million | 42.9% |
| Sub-Saharan Africa | 265 million | 53.6% |
These three regions held over 85% of slum dwellers in 2022. In the Least Developed Countries the share was 60.9%, according to the 2024 Extended Report.
Slums are only part of the problem. UN-Habitat's storyline in the 2025 Extended Report, compiled with information available as of 30 April 2025, estimates that between 1.6 billion and 3 billion people are affected by some form of housing inadequacy. The same text puts the global average housing cost burden at 31.0%, based on data from 124 countries, with the highest average in sub-Saharan Africa (43.5%), followed by Western Asia and Northern Africa (36.9%), and the lowest in Northern America and Europe (21.4%). The report does not give a single reference year for these cost-burden figures.
Affordability in OECD and EU countries
Richer countries use household surveys and a higher threshold. The OECD Affordable Housing Database, indicator HC1.2 (updated in October 2025), counts a household as "overburdened" when it spends more than 40% of its disposable income on housing. It reports two findings:
- The median rent burden of tenant households is highest in Finland (31% of disposable income), Norway (29%), Sweden, Denmark and Iceland (28% each), based on 2024 survey data, and in Chile (27%), based on 2022 data.
- More than half of low-income tenants in the private rental market are overburdened in Chile, Greece, Israel, Malta, New Zealand, Switzerland, the United Kingdom and the United States, using the latest year available, from 2017 to 2024 depending on the country.
Eurostat, which uses the same 40% threshold, publishes annual figures from the EU statistics on income and living conditions. For 2025, its housing cost overburden rate by tenure status shows:
| EU population, 2025 | Overburdened by housing costs |
|---|---|
| All people | 7.7% |
| Tenants paying a market rent | 18.6% |
| Tenants at a reduced rent or rent-free | 9.2% |
| Owners with a mortgage or loan | 5.0% |
| Owners without a mortgage | 3.8% |
| People below the poverty threshold (60% of median income) | 29.1% |
The last row comes from Eurostat's table by poverty status. Among EU countries in 2025, the rate for the whole population ranged from 26.4% in Greece to 2.4% in Cyprus.
These numbers are not directly comparable. UN-Habitat's indicator uses a threshold of 30% of total household income; the OECD and Eurostat use 40% of disposable income, after taxes and including housing allowances. Some series count only rent and mortgage payments, others add utilities, maintenance and service charges. Check the threshold, income concept and cost definition before quoting any affordability figure.
How to check that a rent is fair
National statistics describe averages. A tenant needs to know whether this rent, for this home, is in line with comparable homes. The steps below work in most countries, though the legal tools differ.
1. Start from an official reference, if one exists
Some countries set legal reference rents. In France, Article 140 of the ELAN law allowed volunteer local authorities to cap rents, and Paris has done so for leases signed since 1 July 2019. Each year the prefect sets three reference rents per square metre, based on levels recorded by the local rent observatory: a reference rent, a loyer de référence majoré 20% higher and a loyer de référence minoré 30% lower, broken down by geographic sector, number of rooms, furnished or unfurnished letting and construction period, as the Île-de-France prefecture explains. The base rent, excluding charges, may not exceed the higher figure unless the lease states a justified complément de loyer. The official public-service guide lists the areas covered, which include Paris and two neighbouring territories, Lille, Lyon and Villeurbanne, Montpellier, Bordeaux and parts of Grenoble and the Basque Country, links to online simulators and explains how to go to the free departmental conciliation commission.
In Germany, the reference is the Mietspiegel, a local rent index that sets out the ortsübliche Vergleichsmiete, the usual local rent for comparable homes. Under section 558c of the Civil Code, municipalities with more than 50,000 inhabitants must produce one. In areas that a federal state has designated as tight housing markets, section 556d caps the rent at the start of a new tenancy at no more than 10% above that local comparative rent; such designations must lapse by the end of 2029 at the latest.
2. Use open rent data where there is no cap
France's network of local rent observatories (observatoires locaux des loyers), set up from 2013, publishes rent levels per square metre excluding charges, with filters by type of dwelling, number of rooms, construction period and length of occupancy; the network says its 37 observatories cover 52% of the private rental stock. For the rest of the country, the housing ministry and the national housing information agency, ANIL, publish an experimental "carte des loyers": advertised rents per square metre, charges included, estimated for each commune from 9.1 million listings published between 2019 and 2025. The first measures rents paid, excluding charges; the second asking rents, including them.
3. Compare like with like
Convert every rent into a price per square metre and compare only similar homes: the same neighbourhood or street, the same number of rooms, furnished or unfurnished, and a similar age of building. Floor level, a lift, outdoor space and parking all move the price, and several listings within a few streets say more than a city-wide average.
4. Account for size, condition, energy rating and charges
- Size. Check the floor area stated in the lease against your own measurement; a few missing square metres change the price per square metre.
- Condition. Damp or worn fittings justify a lower rent than a renovated equivalent.
- Energy rating. Poor insulation raises heating bills. In France, according to the family allowance fund (CAF), homes rated G on the energy performance certificate are no longer considered decent for leases signed since 1 January 2025, and since 24 August 2022 the rent of homes rated F or G may not be increased at renewal or revised during the lease.
- Charges. Establish whether the figure includes service charges, heating or water, and ask for a breakdown. Compare rents excluding charges with rents excluding charges.
5. Watch for red flags
- A rent above the legal ceiling where one applies, or a rent supplement with no stated justification.
- Requests for a deposit or "reservation fee" before a visit or a signed lease.
- No written lease, or a refusal to state the floor area or the energy rating.
- Charges set as a lump sum with no explanation of what they cover.
- A rent far below everything else in the area, which can signal a scam rather than a bargain.
Tools: one source among several
The most reliable references are official: reference-rent simulators, local rent observatories, municipal rent indexes such as the Mietspiegel, and national open data. They have legal standing or a published method, but cover only some places and are updated at most yearly.
Private services fill some gaps. Among them, ting.ad, a property platform, publishes a street-level rent comparison: the user drops a pin on their building, enters the floor area and the monthly rent, and can add a short video or photos of the home. The page says the result compares the rent with figures in euros per square metre for the same street, the same block and a point 200 metres away. The same site carries guides to renting and buying apartments and houses, and neighbourhood guides, for several cities. The page does not name its data sources, beyond inviting users to contribute their own rents.
An estimate built from listings or user contributions depends on who has contributed, and has no legal weight in a dispute. Treat it as one input, and cross-check it against an official reference and a few comparable listings before negotiating or signing.
Sources and further reading
- UN metadata for indicator 11.1.1.
- Sustainable Development Goals Report 2024, Goal 11, and the 2024 and 2025 Extended Reports.
- OECD Affordable Housing Database, HC1.2 Housing costs over income.
- Eurostat, housing cost overburden rate by tenure status and by poverty status.
- Service-Public.fr on rent control and the Observatoires des loyers.
Related explainers: legal identity for all, and how the EU and the UN work together on the SDGs.
 Inclusion and rights
SDG 16.9: legal identity for all
Birth registration, the people still without proof of identity, and the safeguards digital ID systems need.
 Cooperation and skills
How the EU and the UN work together
The EU's status at the UN, Team Europe and Global Gateway, SDG reporting, research cooperation and the tensions worth knowing.
 Health and data
Health data and the SDGs
What SDG 3 asks countries to measure, where the numbers come from, and why so many health systems still lack timely data.