GBIF: how billions of species records are shared worldwide, and where the map is still blank
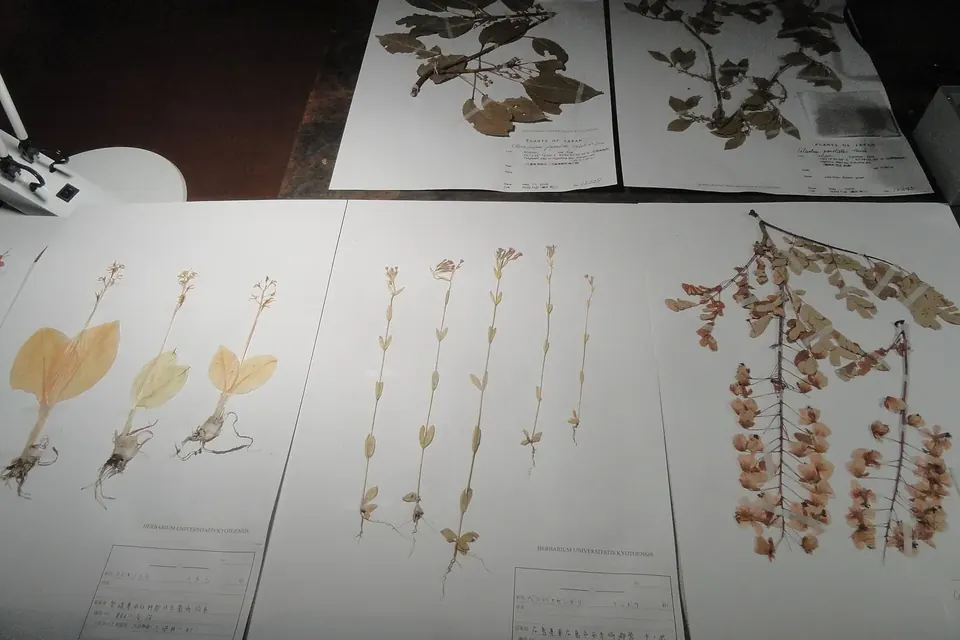
To know whether a species is declining, spreading or disappearing, scientists first need to know where it has been seen, and when. That information is scattered across centuries of museum drawers, field notebooks, research surveys and smartphone apps. The Global Biodiversity Information Facility, GBIF, is the international network that gathers it into one open, searchable pool. It is one of the less visible research infrastructures behind the biodiversity goals, and its own statistics show both how far open data has come and how unevenly the planet is covered.
What GBIF is, and what it is not
GBIF was established in 2001 by governments that agreed to make biodiversity data freely available, following a recommendation made in the late 1990s by a working group of the OECD's science forum. Its secretariat is hosted in Copenhagen. It is an intergovernmental network, not a treaty organisation: countries and organisations join as participants by signing a memorandum of understanding, contribute to its budget and sit on its governing board. Each participating country is expected to set up a national node, a team that helps institutions at home publish their data and use what others have published.
GBIF does not collect specimens or run field surveys itself. It is closer to a library catalogue than to a laboratory: the data stay with the institutions that publish them, and GBIF indexes, checks and redistributes them. In that sense it complements the infrastructures described in our explainer on LifeWatch ERIC, which builds analysis tools and virtual laboratories on top of data from GBIF and others.
How a record reaches GBIF
The basic unit is the occurrence: evidence that a given organism was at a given place at a given time. A herbarium sheet collected in 1890, a bird reported on a checklist last weekend, a DNA sample from a river and a camera-trap photograph can all become occurrences. To make such different sources comparable, publishers describe them with Darwin Core, a vocabulary maintained by the standards body Biodiversity Information Standards (TDWG), with fields such as scientific name, coordinates, date and basis of record.
Most institutions publish through the Integrated Publishing Toolkit, free software that turns a spreadsheet or database export into a standard dataset and registers it with GBIF. GBIF then matches every name against its taxonomic backbone, flags suspicious records (coordinates at sea for a land plant, a date in the future) and makes the result searchable through its website and a public programming interface.
Two rules make the system usable for science. First, every dataset carries one of three licences: CC0, CC BY or CC BY-NC, so users know in advance what reuse is allowed. Second, every download is given a DOI, a permanent identifier that lists exactly which datasets were used. When a paper cites that DOI, credit flows back to every museum or project whose records it drew on. This is the practical side of the principles discussed in our article on open science and the UNESCO Recommendation: findable, citable and reusable data, with an incentive for the people who hold it to share.
What 3.9 billion records contain
GBIF's figures change every day, so we queried its public occurrence API directly on 5 November 2026. It returned 3,890,491,697 occurrence records drawn from 125,327 datasets. Breaking that total down with the same interface gives a clearer picture of what the pool is made of.
| Basis of record | Records | Share of total |
|---|---|---|
| Human observation | 3,237,834,492 | 83.2% |
| Preserved specimen (museums, herbaria) | 288,830,860 | 7.4% |
| Material sample (for example DNA) | 232,493,390 | 6.0% |
| Machine observation (sensors, camera traps) | 50,007,600 | 1.3% |
Smaller categories, such as fossil and living specimens, make up the remainder. The table shows how much biodiversity data has changed in two decades. Natural history collections, the historical backbone of the field, now account for well under a tenth of the records. Observations by people, a large part of them made by volunteers through birdwatching and nature-recording platforms, dominate. Birds alone, the class Aves, account for 2,266,018,567 records, or 58.2% of the total.
Where the map is still blank
The same query, broken down by the continent where each organism was recorded, shows how unevenly that effort is spread.
| Continent | Records | Share of all records |
|---|---|---|
| North America | 1,535,473,030 | 39.5% |
| Europe | 1,408,615,656 | 36.2% |
| Oceania | 265,832,371 | 6.8% |
| Asia | 186,255,751 | 4.8% |
| South America | 145,707,718 | 3.7% |
| Africa | 97,016,429 | 2.5% |
| Antarctica | 2,770,813 | 0.1% |
The shares do not add up to 100% because some records, notably many from the open ocean, carry no continent. Even so, the pattern is stark. North America and Europe together hold about three quarters of all records. Records located in the United States alone, 1,263,123,738 of them, are almost three times as many as those from Asia, South America and Africa combined. Africa, Asia and South America include most of the world's tropical forests and many of its biodiversity hotspots.
These numbers measure recording effort, not biodiversity. A species-rich region with few records is not poorly endowed; it is poorly documented. The consequences are practical. Models that predict where a species lives, or how its range will shift with climate change, are only as good as the points they are trained on. Gaps in the data can make a threatened species look rare where nobody has looked, or common where volunteers are numerous. Researchers using GBIF routinely have to correct for this sampling bias, and the largest gaps sit in the very regions where land-use change is fastest.
Why it matters for the SDGs and the biodiversity framework
SDG 15 (life on land) and SDG 14 (life below water) both depend on knowing what lives where. In December 2022, the parties to the Convention on Biological Diversity adopted the Kunming-Montreal Global Biodiversity Framework, with four goals and twenty-three targets for 2030. Several of them, from conserving 30% of land and sea to reducing the introduction of invasive species, require species distribution data to set baselines and track progress, and one target is devoted to making data, information and knowledge accessible to decision-makers.
Open occurrence data feed into assessments of extinction risk, studies of invasive species and the global and regional assessments produced for governments by scientific panels. They also combine with satellite products, of the kind described in our explainer on space technology and the SDGs: a satellite can map forest cover, but only records on the ground say which species that forest still holds.
Closing the gaps
The remedies are well known, and each falls under SDG 17's call for capacity-building and technology sharing:
- Digitising collections held outside the regions they describe. A large share of historical specimens from Africa, Asia and Latin America sits in European and North American museums. Publishing their labels returns information to the countries where the specimens were collected.
- Funding national nodes and data mobilisation. GBIF and its partners run small grant programmes and training for institutions in under-represented regions; their reach depends on stable funding from participants.
- Supporting local recording. Citizen science works where there are platforms in local languages, connectivity and people with time to take part, conditions that are not evenly distributed either.
- Respecting data sovereignty. Exact locations of threatened species or culturally sensitive places can be generalised before publication, and Indigenous and local communities increasingly expect a say in how data about their lands are shared.
GBIF shows what an open, shared infrastructure can achieve with modest central resources: billions of records, free to use, each traceable to its source. Its own numbers also show the limit of goodwill alone. Where the institutions, budgets and volunteers are missing, the data are too, and the places that most need biodiversity information to plan for 2030 are still the ones with the least of it.
Sources and method
- GBIF occurrence API, queried on 5 November 2026 with facets on basis of record, class, continent and country (the totals are recalculated continuously and will have moved since). GBIF's own site, gbif.org, describes its governance, participants and data licences.
- Convention on Biological Diversity, Kunming-Montreal Global Biodiversity Framework (decision 15/4, December 2022).
- Biodiversity Information Standards (TDWG), Darwin Core standard.
 Research infrastructures
LifeWatch ERIC and biodiversity data
How a European research consortium gives ecologists shared data, models and virtual labs, and what that means for SDGs 14 and 15.
 Cooperation and skills
Open science and the SDGs
The 2021 UNESCO Recommendation, its seven areas of action, FAIR and CARE data, and who pays for openness.
 Research infrastructures
Space technology and the SDGs
Earth observation, navigation and communications satellites, the UN framework behind them, and the risks of crowded orbits.